Learn It Part 2
There is a special type of piecewise function called a step function. A step function increases or decreases with constant pieces, or intervals. When it is graphed, it looks like steps. Here is an example:
During the holidays, some stores will do a ”round up” program. This means they round a customer’s total bill up to the nearest dollar and donate to charity the difference between the bill and rounded amount. The following step function models this.
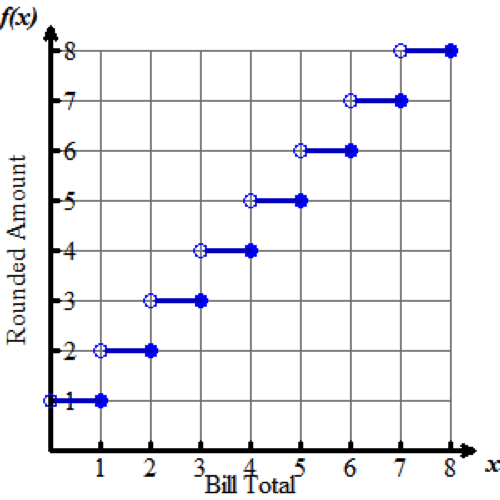
See how the function looks like stair steps? This is a special step function called a ceiling function. This is because it takes the least integer that is greater than or equal to x. For example, if a customer’s bill is x=$3.58, the least integer that is greater than or equal to x is $4.00. Therefore, the bill will be rounded to x=$4.00.
Step functions may use the same notation as piecewise functions, but other times they may use their own specific notation. For example, a ceiling function has its own notation, f of x equals the ceiling function x. This is noted as two bars with hooks at the top, centered around x..

Graphing step functions is no more difficult than graphing constant linear functions. The following activity will detail how to graph a step function.