This module is for Algebra 1, Grades 7-12 Welcome
Is the Earth flat or round? Of course, you know the Earth is round. But when you look outside, does the ground look curved? We can easily understand how, many years ago, people thought the Earth was flat. Mathematicians such as Pythagoras, Aristotle and Eratosthenes dedicated many years of intense mathematical calculation to prove the Earth is, indeed, round despite its flat appearance.

Eratosthenes, a Greek mathematician, was one of the first people to accurately measure the circumference of the Earth.
Looks can be deceiving, even in science and mathematics. The graph below shows population growth for the United States between 1915 and 2015.
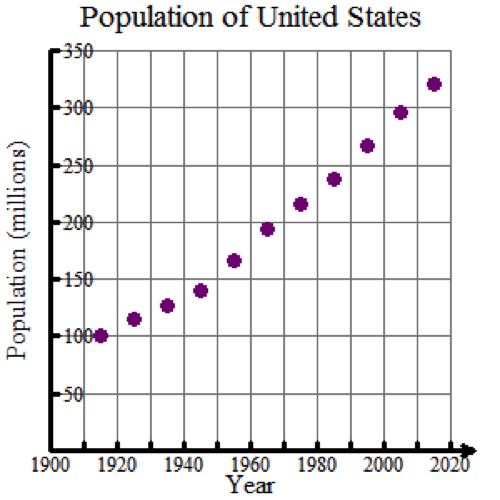
The relationship between the Population of the United States and the Years appears to be linear. However, population growth is usually exponential. Could this relationship actually be exponential? Could the relationship be quadratic?
In this module, you first will learn how to perform linear, exponential and quadratic regressions to determine the curve of best fit for a set of data. Next, you will analyze the fit of the regression curve using residuals and residual plots to determine which curve fits the given data the best.
Module Objectives
By the end of this module, you will be able to:
- Perform linear, exponential and quadratic regressions.
- Analyze the fit of a regression line/curve using correlation coefficients and the coefficient of determination.
Skills
- Construct a scatterplot and analyze the trend of the data.
- Calculate the equation for the curve of best fit.
- Graph a residual plot to assess the fit of the regression curve.
- Use the correlation coefficient, the coefficient of determination, and the residual plot to determine the curve of best fit.