Learn It
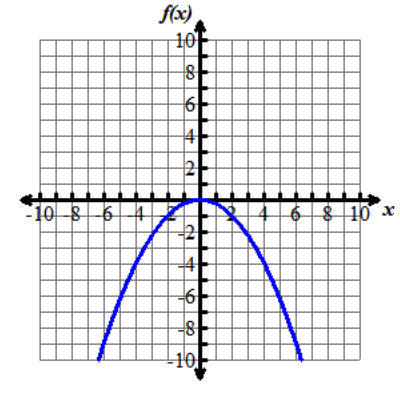
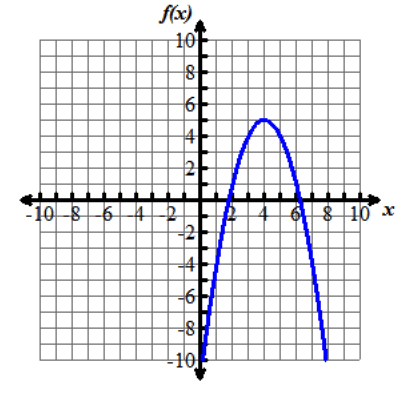
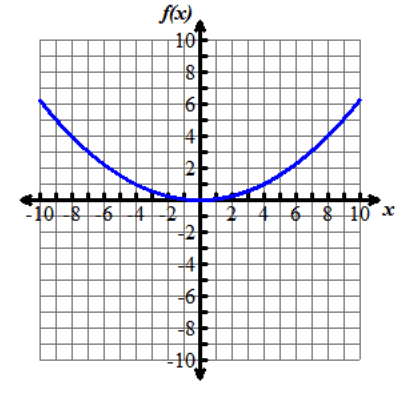
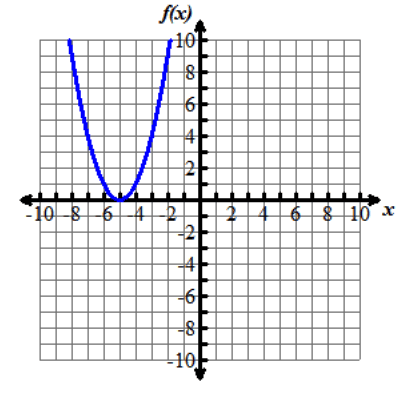
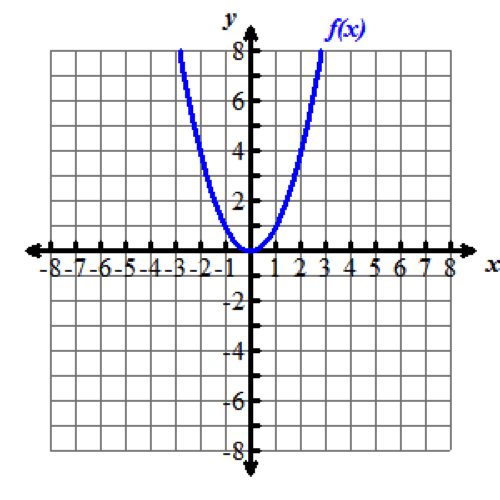
Look at the graphs below. All of the functions graphed are altered versions of one parent function, f of x equals x squared. This parent function f of x equals x squared has been transformed to form the eight other functions.
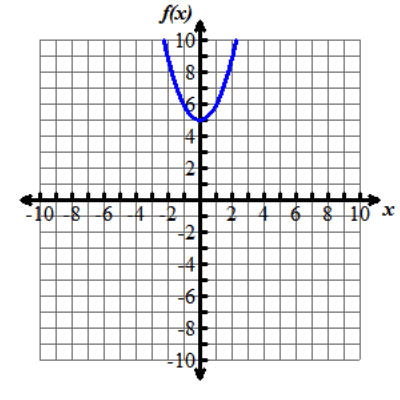
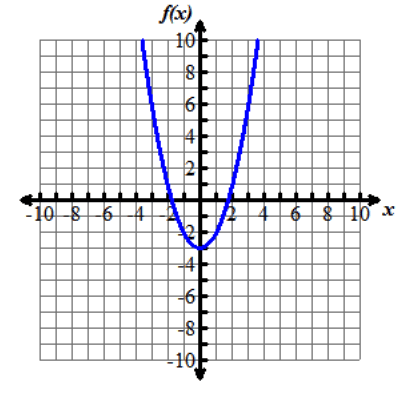
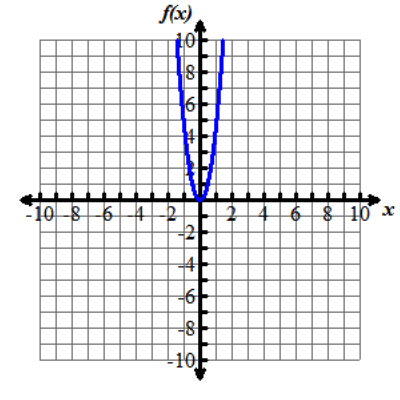
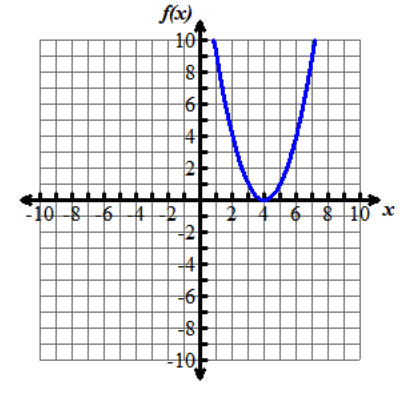
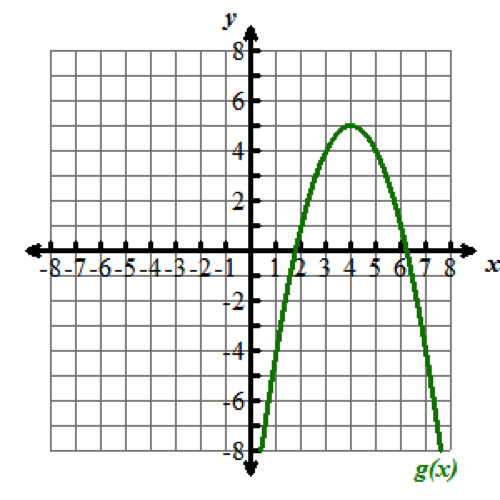
Nine graphs displaying different parabolas are shown. In each graph, both the x and y axes extend from negative 10 to 10, with the x axis labeled with an x and the y axis labeled as f of x. Graph 1 shows the parent function f of x equals x squared, which is a parabola opening up with a vertex at the origin. Graph 2 shows the graph of a parabola opening up whose vertex is at the point (0, 5). Graph 3 shows the graph of a parabola opening up whose vertex is at the point (0, negative 3). Graph 4 shows the graph of a very skinny parabola opening up whose vertex is at the point (0, 0). Graph 5 shows the graph of a very wide parabola opening down whose vertex is at the point (0, 0). Graph 6 shows the graph of a parabola opening down whose vertex is at the point (4, 5) and crosses the x axis at x equals 2 and x equals 6. Graph 7 shows the graph of a very wide parabola opening up whose vertex is at the point (0, 0). Graph 8 shows the graph of a parabola opening up whose vertex is at the point (negative 5, 0). Graph 9 shows the graph of a parabola opening up whose vertex is at the point (4, 0).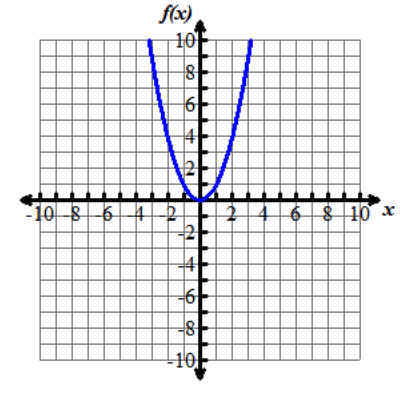
Functions can be modeled in the xy-coordinate plane. By transforming the equation of a function, the graph of the function can be transformed about the plane.
Explore the following videos to learn how functions are transformed in the xy-coordinate plane.
Transformation: f of x plus k
Watch the following video to see how the function f of x is transformed by adding a value of k to the function. That is, f of x plus k.
> Text version for video: Transformation: f(x)+k Opens a new window
f of x plus k
Adding a value of k to a function f of x translates the graph up vertically when k is positive and down vertically when k is negative.
Transformation: f of the quantity x plus k
Now let’s examine the effects of adding a value of k to the domain (x) of f of x, forming the function f(x+k)f of the quantity x plus k.
Before you watch the video, do you have any predictions about how the function may be transformed?
Watch the following video to see if you are correct.
> Text version for video: Transformation: f(x+k) Opens a new window
f of the quantity x plus k
Adding a value of k to the domain of the function f of x translates the graph of the function left horizontally k units when k is positive and right horizontally when k is negative.
Transformation: kf(x)
Now watch the following video to see how the function f(x) is transformed by multiplying a value of k by the function. That is, kf(x).
> Text version for video: Transformation: kf(x) Opens a new window
k times f of x
When a function f of x is quadratic or exponential, multiplying by k will dilate the function for large values of k and reduce the function for small, positive values of k.
For linear functions, multiplying by k will increase the slope of the line for large values of k and decrease the slope of the line for small, positive values of k.
negative f of x
When k is negative, the function is reflected, or flipped, in the x-axis.
Transformation: f of the product of k and x
We have one more transformation to examine. Watch the following video to see how the function f of x is transformed by multiplying a value of k to the domain (x) of the function. That is, f of the product of k and x.
> Text version for video: Transformation: f(kx) Opens a new window
f of the product of k and x
When the function f of x is a quadratic function, multiplying a value of k to the domain (x) of the function will dilate (or stretch) the parabola for small, positive values of k and reduce (or shrink) the function for large values of k.
For exponential functions, multiplying a value of k to the domain (x) of the function will dilate (or stretch) the curve for small, positive values of k and reduce (or shrink) the curve for large values of k.
For linear functions, multiplying the domain by k will increase the slope of the line for large values of k and decrease the slope of the line for small values of k.
f of negative x
When k is negative, the line is reflected (or flipped) in the y-axis.