Learn It Part 2
Here are the temperatures for one afternoon in Nottingham, MD.
| Hours Since Noon | Temperature (°F) |
|---|---|
| 0 | 48 |
| 1 | 50 |
| 2 | 52 |
| 3 | 54 |
| 4 | 52 |
| 5 | 51 |
| 6 | 46 |
Use your graphing calculator to plot a scatterplot of the data. What function family does this data appear to model? Click Show Answer.
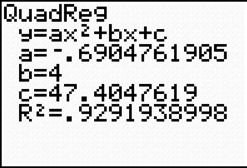
Selecting the quadratic regression, the calculator provides a quadratic equation that may fit the data.


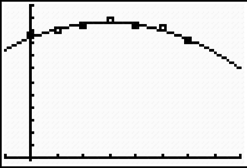
When the equation is graphed, we can see for ourselves that the fit does seem close! Thus, the equation y equals negative sixty nine hundredths x squared plus four x plus forty seven and four tenths can model this data.
We can interpolate what the temperature was at 2.5 hours since noon (2:30 p.m.).
y equals negative sixty nine hundredths x squared plus four x plus forty seven and four tenths
y equals negative sixty nine hundredths times two and five tenths squared plus four times two and five tenths plus forty seven and four tenths
y equals fifty three and 8 hundredths
At 2:30 p.m., it was approximately 53.08°F.
Notice that the calculator is giving an R squared value instead of an r value. R squared is known as the coefficient of determination. It works the same as the correlation coefficient in that iR squaredt is a measure of how well the regression line represents the data. It represents the percent of the data that is the closest to the regression curve (or curve of best fit).

Since the R value has been squared, the coefficient of determination will always be positive, and always will be between 0 and 1. The closer the value is to +1, the stronger the fit; the closer to 0, the weaker the fit.
The coefficient of determination for the temperature data is very high (i.e., very close to 1). Thus, the quadratic equation was a good fit for the data.
Any interpolations we calculate and conclusions we make using the equation are statistically reliable. What if we thought a linear equation or an exponential equation would better fit the temperature data for Nottingham, MD?
Click Show Answer.
Tip
The correlation coefficient is a measurement of how well a regression line fits the data. The value of the correlation coefficient is always between negative1 and 1. The closer the value is to negative1 or 1, the better the fit. The closer the value is to 0, the worse the fit.
The coefficient of determination compares how well the dependent variable is predicted from the independent variable in the regression equation. The coefficient of determination will always be positive and will always be between 0 and 1. The closer the value is to positive1, the stronger the regression curve fits the data. The closer the value is to 0, the weaker the fit.


