Glossary

Data:

Sets of facts, such as numbers, words, measurements, observations, etc.

Interquartile Range:

The difference between the upper and lower quartiles in a data set.

Mean:

The average of the data set. The sum of all the values in a data set divided by the number of data values.

Median:

The middle value in an ordered data set. For a data set with an even number of values, the median is the average of the two middle values.

Quartile:

The median of the upper or lower half of a data set.

Range:

The difference between the highest data value and the lowest data value.
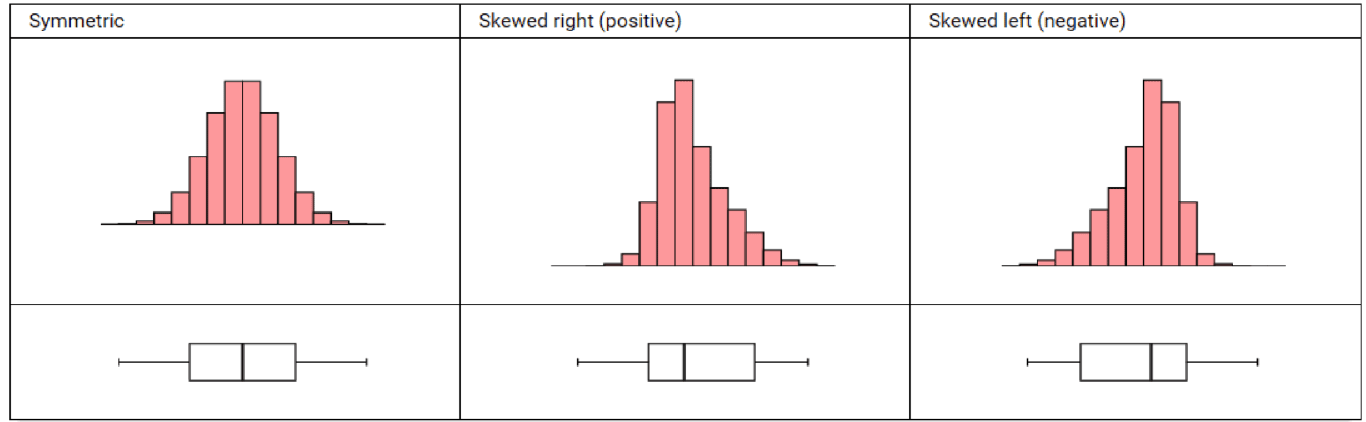
Skewed Data:

Data distributions in which the data distribution is pulled towards outlying values.
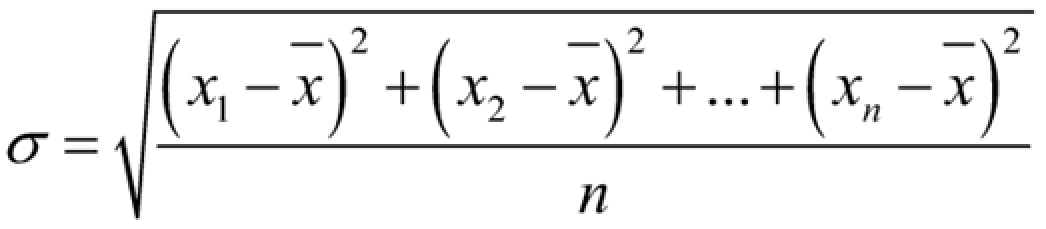
Three different data distributions are shown. The first data distribution labeled symmetric shows  a histogram and a box and whisker plot to describe symmetric data. The histogram has the tallest bars at the center of the data. The bars to the left and right decrease in height, with corresponding bars being at equal heights. The box and whisker plot has the boxes of equal width and whiskers of equal length. The median bar falls in the middle of the box.  The second data distribution labeled Skewed right positive shows a histogram and a box and whisker plot to describe data that is skewed right. The histogram has the tallest bars at the left. The bars to the right decrease in height. The box and whisker plot has the right box and right whisker longer than the left box and left whisker. The median bar falls to the left of the center box. The this data distribution labeled skewed left negative shows a histogram and a box and whisker plot to describe data that is skewed left. The histogram has the tallest bars at the right. The bars to the left decrease in height. The box and whisker plot has the left box and right whisker longer than the right box and left whisker. The median bar falls to the right of the center box.

Standard Deviation:

A measure of how spread out the numbers are in a data set.

sigma equals the square root of the quantity of x sub one minus x bar squared plus the quantity of x sub 2 minus x bar squared plus etcetera plus x sub n minus x bar squared divided by n

Statistics:

The study of data based on the collection, representation, and interpretation of data.

Symmetrical Data:

Symmetry describes the shape of a data distribution. When the data is graphed, a symmetrical distribution can be divided at the mean so that each half is a mirror image of the other.

Variability:

The extent to which individual data values change within a set or collection of data.