Learn It
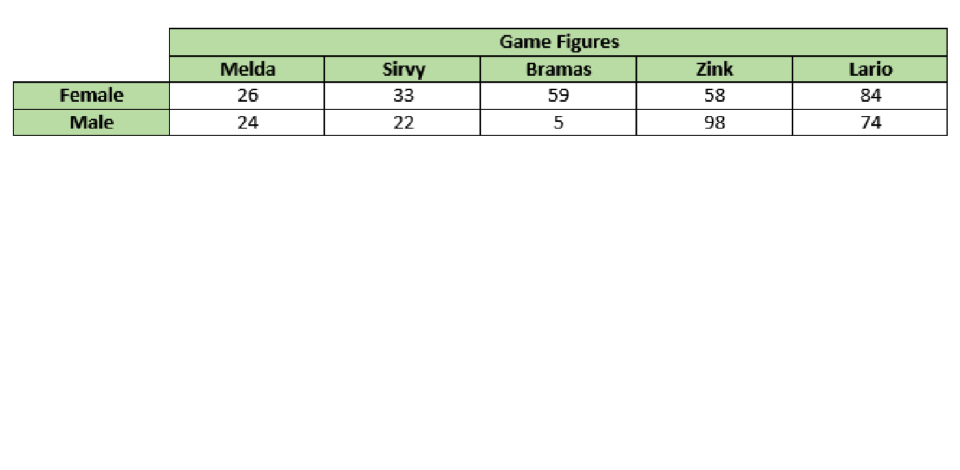
A popular video game company releases interactive game figures for new games. The figures unlock virtual worlds, bonus levels and other special advancements in the games. The retailers would like to know which action figures are preferred by females and which figures are preferred by males. They surveyed random customers and collected the data in a two-way frequency table, shown below.
|
Game Figures |
|
Melda |
Sirvy |
Bramas |
Zink |
Lario |
| Female |
26 |
33 |
59 |
58 |
84 |
| Male |
24 |
22 |
5 |
98 |
74 |
A table displaying the survey results of the Game Figures. The five columns in the table are Melda, Sirvy, Bramas, Zink, and Lario. The two rows in the table are Female and Male. Going across the Female row, the cells read 26, 33, 59, 58, 84. Going across the Male row, the cells read 24, 22, 5, 98, 74.
It is called a two-way table because it can be read two ways, vertically and horizontally, and the variables categorized in the table can be compared in those two ways.
What is the ratio of females that prefer the character Sirvy? What ratio of all gamers prefers Lario? According to the survey, which character is least preferred by both males and females?
The two-way frequency table makes questions like these easier to answer.
Explore the following slideshow to learn how to read a two-way frequency table in order to make informed decisions. Visit the Glossary for definitions of bolded terms in the slideshow.
Shown here is a two-way frequency table.
A two-way frequency table is a data display that allows us to easily examine the relationship between two categorical variables.
In this table, the two variables are the Game Figures and the males and females.
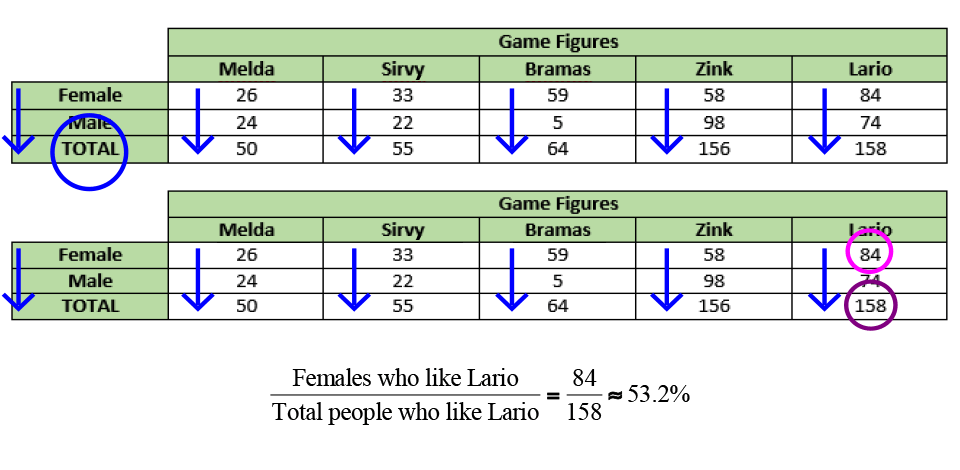
The table can be read vertically.
Reading the table vertically answers questions such as:
What ratio of the people who like Lario are female?
To answer this question, find the number of females who like Lario out of the total number of people who like Lario. This is a ratio. It is the number of females who like Lario divided by the total number of people who like Lario.
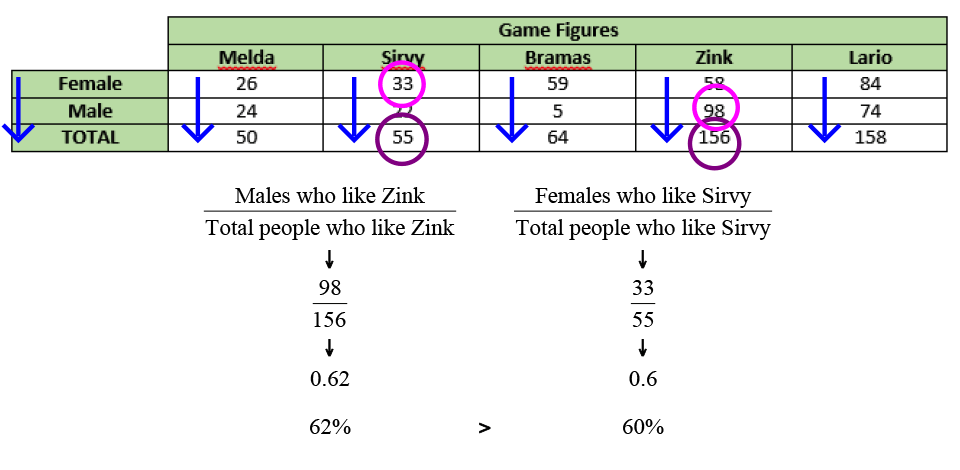
Here is another example:
Compare the ratios of people who like Zink that are males to the proportion of people who like Sirvy that are females.
The percent of participants who like Zink and are male (62%) is greater than the percent of participants who like Sirvy and are female (60%).
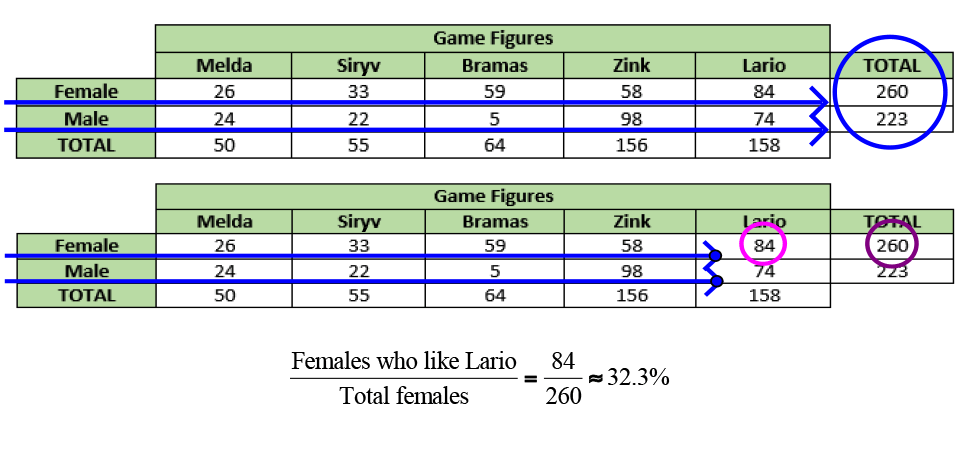
The table can be read horizontally, also.
Reading the table horizontally answers questions such as:
What ratio of females like Lario?
To answer this question, find the number of females who like Lario out of the total number of females. This is a ratio. It is the number of females who like Lario divided by the total number of females.
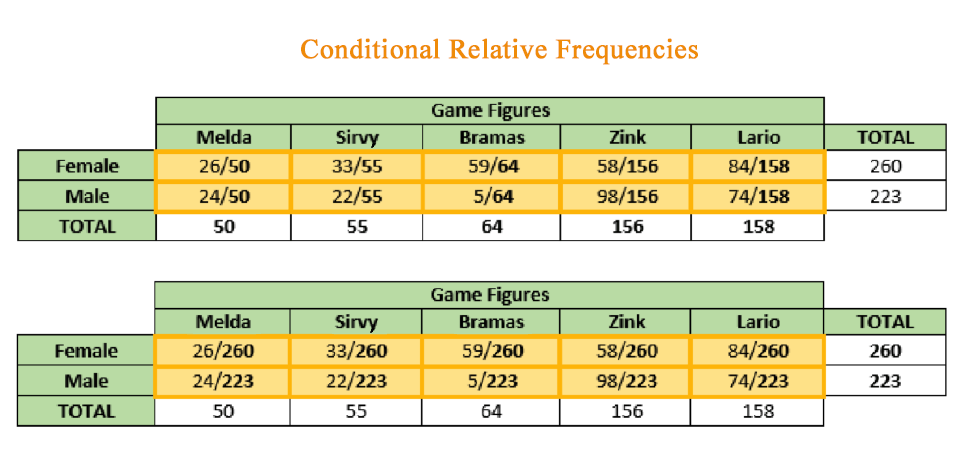
The ratios that compare the middle table values to the total amount of the corresponding rows or columns are called conditional relative frequencies.
They are called “conditional” because they set the condition of what row or column to look in.
The table can be read holistically, viewing the margin totals for each category.
Reading the table using the holistic total answers questions such as:
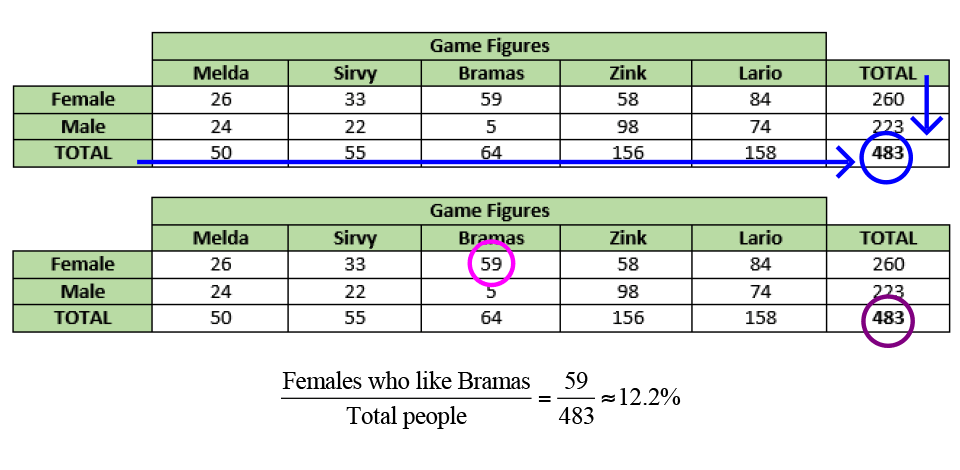
What ratio of the people surveyed were female and liked Bramas?
To answer this question, find the number of females who like Bramas out of the total number of people. This is a ratio. It is the number of females who like Bramas divided by the total number of people.
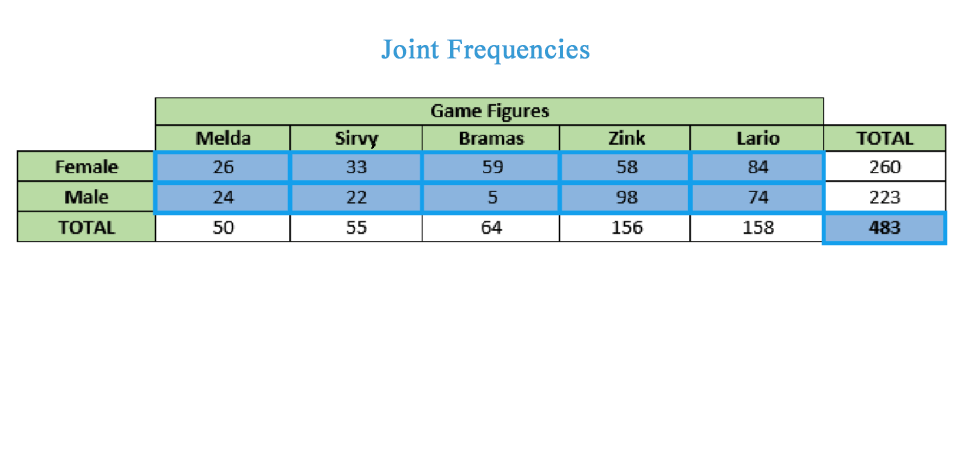
When a ratio compares a cell in the center of the table to the overall total, this is called a joint frequency.
The table could be read holistically to answer questions like this:
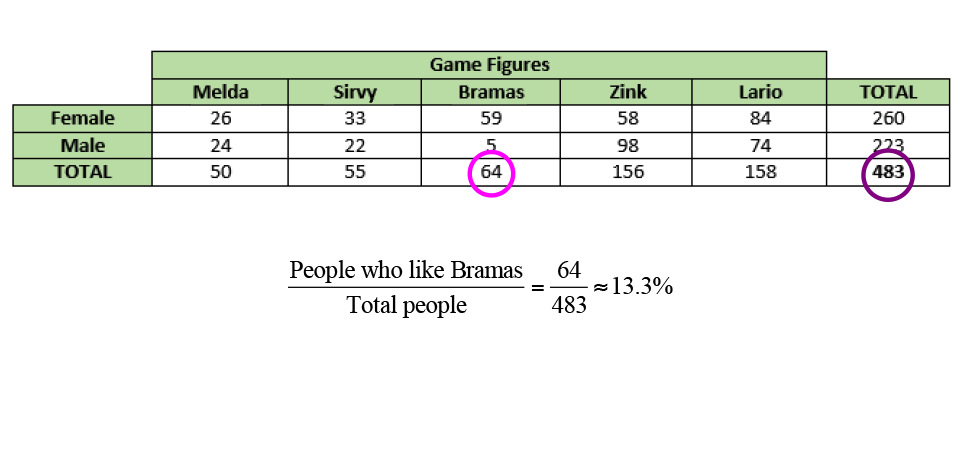
What ratio of the people surveyed liked Bramas?
To answer this question, find the number of people who like Bramas out of the total number of people. This is a ratio. It is the number of people who like Bramas divided by the total number of people.
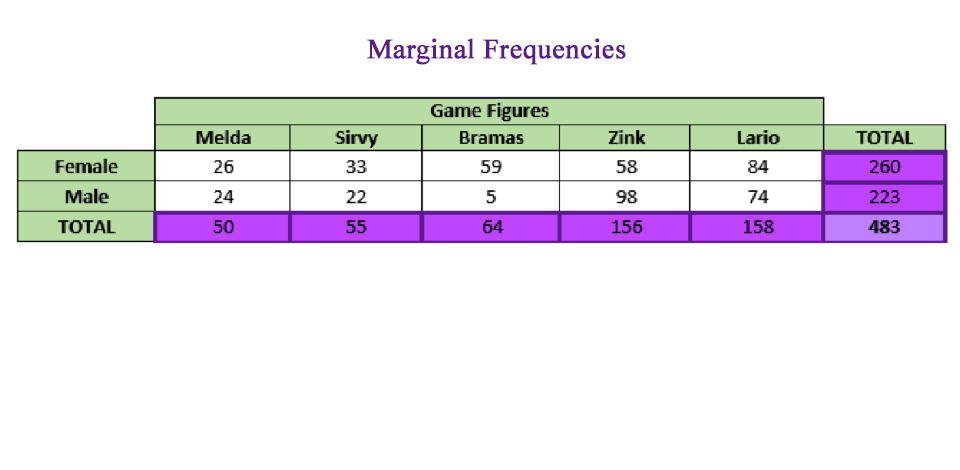
When a ratio compares a total margin amount to the overall total in the table, this is called a marginal frequency.

A note of caution! Do not get too hung up on memorizing the terms joint frequency, marginal frequency, and conditional relative frequency. It is more important to understand which ratio (or frequency) the question is asking for. Be sure to read the prompts carefully so you know what you are being asked to find.
Two-Way Frequency Table Tip
The ratios that compare the middle table values to the total amount of the corresponding rows or columns are called conditional relative frequencies.
When a ratio compares a cell in the center of the table to the overall total, this is called a joint frequency.
When a ratio compares a total margin amount to the overall total in the table, this is called a marginal frequency.