Select an answer(s) from the options below and click Submit.
Question 1
The data set lists the money raised by twelve students who participated in a candy bar sale. Find the mean and the standard deviation for this one data set. Select one choice for mean and one choice for standard deviation from the options below.
Money Raised from Candy Bar Sales
- $15
- $95
- $41
- $18
- $91
- $74
- $52
- $15
- $5
- $35
- $52
- $34
Answer: Correct! Go to question 2.
Answer: Incorrect. The answers are:
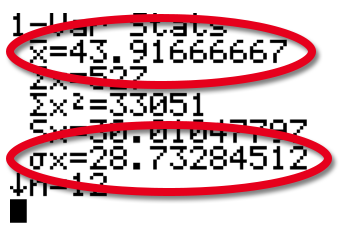
B. xx bar = $43.92
E. σsigma = $28.73
Here is the screen shot from the one-variable statistics calculations using the graphing calculator. These answers are circled.

Go to question 2.
B. xx bar = $43.92
E. σsigma = $28.73
Here is the screen shot from the one-variable statistics calculations using the graphing calculator. These answers are circled.

Go to question 2.
Answer: One or more of your answers are incorrect. Try again. Remember to use your graphing calculator to perform these calculations. Be sure to reference the correct symbols: xx bar represents the mean, and σ represents the standard deviation.
Select an answer from the options below and click Submit.
Question 2
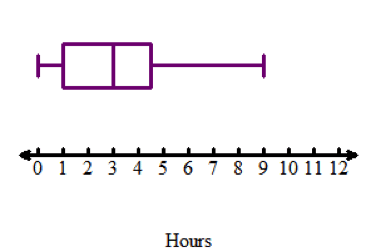
Members of a high school’s honors orchestra and of the high school’s honors band performed at community events to raise money. The data displays below show the number of hours each member performed.

Honors Orchestra
(Hours)
- 15
- 4
- 2
- 15
- 4
- 6
- 13
- 10
- 12
- 1
- 15
- 13
- 15
- 14
- 9
- 12
Honors Band
(Hours)

Which statements are true about the data for the orchestra and the band? Select all that apply.
Answer: Correct! Go to question 3.
Answer: Incorrect. The answers are:
B. The median time for the orchestra is greater than the median time for the band. Calculate the median for the Orchestra using your graphing calculator. The middle bar in the box and whisker plot represents the median for the Band.
D. The interquartile range for the orchestra is greater than the interquartile range for the band. Calculate the interquartile range for the Orchestra using your graphing calculator. The range of the middle box in the box and whisker plot represents the interquartile range for the Band.
F. Standard deviation is greater when extreme data values are present. The honors orchestra data ranges from 1 hour to 15 hours, with the majority of the data clustering between 12 to 15 hours. Because of the extremely low values of 1 and 2 hours, and the wider range, the honors orchestra would have a larger standard deviation.
G. The data for the orchestra is skewed left. Use your graphing calculator to construct a box and whisker plot of the data. Notice how the left whisker stretches out to the left.
H. The data for the band is skewed right. Notice how the right whisker of the box and whisker plot stretches far to the right.
Go to question 3.
Answer: One or more of your answers are incorrect. Try again. Interquartile range is the difference between the first and third quartile. In data that is skewed left, the majority of the data is greater than the mean. In data that is skewed right, the majority of the data is less than the mean. Remember that standard deviation is greater when extreme data values are present.
Select an answer(s) from the options below and click Submit.
Question 3
Jump Rope for Life is a fundraiser in which students jump rope as many times as they can without stopping. Participants raise money for every jump they make. The physical education teacher at Victory Elementary School records the number of jumps each of her students make.
Female Students
- 7
- 25
- 25
- 6
- 18
- 16
- 24
- 2
- 8
- 24
- 1
- 2
Male Students
- 5
- 15
- 0
- 10
- 15
- 0
- 3
- 9
- 18
- 6
- 2
- 15
Which statements are true about the data for the male and female students? Select all that apply.
Answer: Correct! Go to question 4.
Answer: Incorrect. The answers are:
A. On average, the female students can jump more than the male students.
D. The male data is more consistent than the female data.
Go to question 4.
A. On average, the female students can jump more than the male students.
D. The male data is more consistent than the female data.
Go to question 4.
Answer: One or more of your answers are incorrect. Try again. Use your graphing calculator to calculate the one-variable statistics. Use the standard deviation and the quartiles to analyze the variability of the data sets.
Select an answer from the options below and click Submit.
Question 4
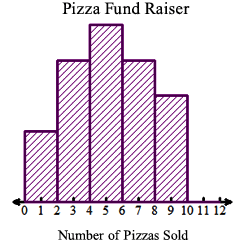
The value for standard deviation is close to 0 for symmetrical data sets, and it becomes greater as data sets become less symmetrical. Which histogram(s) below represents a data distribution with the greater standard deviation than the one shown? Select all that apply.


Answer: Correct! Go to question 5.
Answer: Incorrect. The answers are A, B and D. Standard deviation is the measure of how the data are spread around the mean. For A, B and D, the data are not symmetric and will have a larger standard deviation than data that are symmetric, like the given graph and the graph shown in C.
Go to question 5.
Go to question 5.
Answer: One or more of your answers are incorrect. Try again. Standard deviation is a measure of variability in the data. The value represents the average distance between individual data values and the mean. Think about where the mean falls in each graph, and how the data values fall around the mean. Which data sets are skewed?
Select an answer from the options below and click Submit.
Question 5
Members of the twelfth grade class at a local high school are collecting quarters to buy a class gift for the school. The gift will be presented at graduation. They begin by collecting quarters during lunch shifts, and they tally donations by homerooms.
The data summary below describes the amount of money donated in the 12th grade homerooms.
After recording the data, the student council president realizes that one data value was entered incorrectly. A deposit of 1 quarter was accidently recorded as 100 quarter.
Which value(s) will be most affected by this error? Select all that apply.
The data summary below describes the amount of money donated in the 12th grade homerooms.
| 12th Grade Homerooms | Number of Quarters Donated |
|---|---|
| Mean | 70 |
| Standard Deviation | 12.5 |
| Number of Participants | 152 |
| 1st Quartile | 30 |
| Median | 80 |
| 3rd Quartile | 92 |
Which value(s) will be most affected by this error? Select all that apply.
Answer: Correct!
Answer: Incorrect. The answers are: A and D. The mean and the standard deviation use the actual values of the data points in their calculations. The median and the interquartile range do not. Therefore, the mean and the standard deviation are more sensitive to extreme values, or outliers.
Answer: One or more of your answers are incorrect. Try again. Consider what measures are most affected by outliers.