Click each topic to learn more.
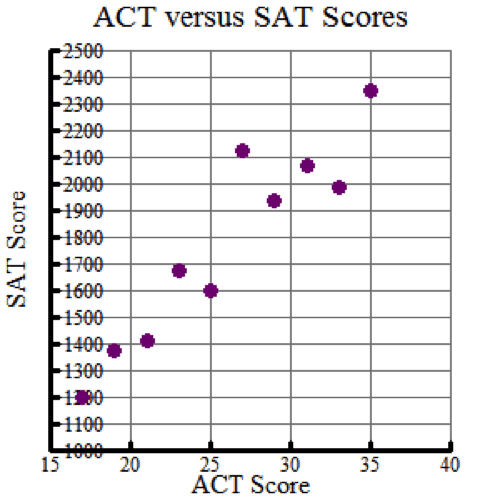
Construct a ScatterplotConstruct a scatterplot of the data. Analyze the distribution of the points in the scatterplot to determine the possible correlation between the variables.
In this example, it appears that there may be a linear relationship between a student’s ACT score and his/her SAT score.
| ACT Score | SAT Score |
|---|---|
| 17 | 1200 |
| 19 | 1375 |
| 21 | 1410 |
| 23 | 1675 |
| 25 | 1600 |
| 27 | 2125 |
| 29 | 1940 |
| 31 | 2070 |
| 33 | 1990 |
| 35 | 2350 |
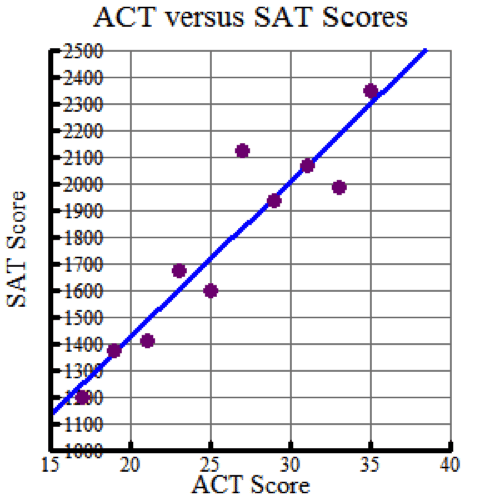
Calculate the regression curve, or the curve of best fit.
In this example, the linear regression equation is y = 58.4091x + 254.864, where x is the ACT score and y is the corresponding SAT score.
| ACT Score | SAT Score |
|---|---|
| 17 | 1200 |
| 19 | 1375 |
| 21 | 1410 |
| 23 | 1675 |
| 25 | 1600 |
| 27 | 2125 |
| 29 | 1940 |
| 31 | 2070 |
| 33 | 1990 |
| 35 | 2350 |
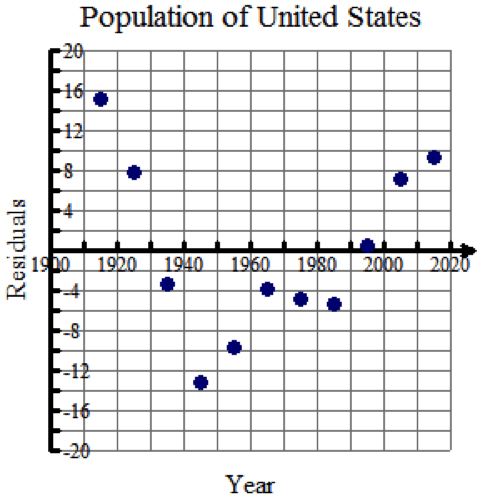
A residual is the difference between the actual data point and the corresponding predicted value along the regression curve (or line).
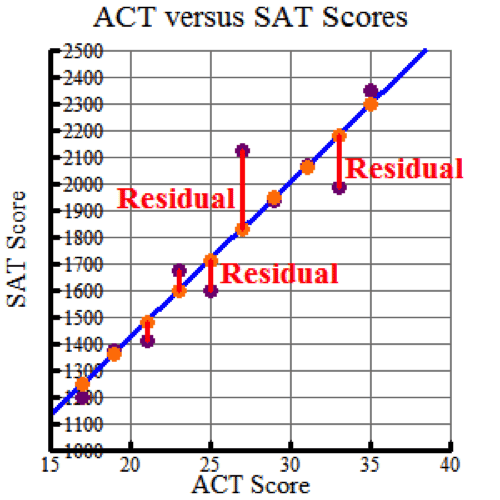
A residual plot graphs these residual values with respect to the independent variable in the situation.
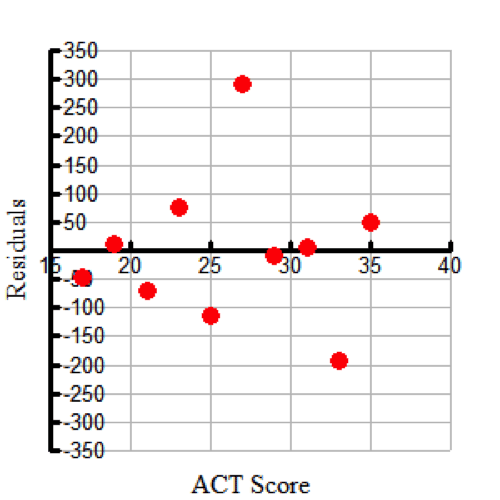
Residual plots that display a scatter of points equally above and below the horizontal axis, with no distinct pattern, signify that the regression curve is a good fit for the data.
This residual plot signifies the regression curve is a good fit.
(This residual plot signifies the regression curve is a bad fit.)