Click on a box to explore each topic.
Step 1Determine the general association of the data.
Graph the data as a scatterplot. Observe the general association between the variables. Does the graph appear to be linear, quadratic or exponential?
| Linear Function Families | Quadratic Function Families | Exponential Function Families |
|---|---|---|
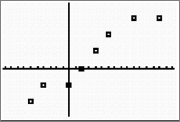 |
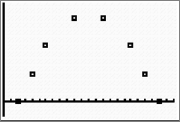 |
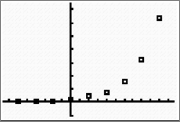 |
| y=mx+by equals m x plus b | y=ax2+bx+cy equals a x squared plus b x plus c | y=a⋅bxy equals a times b to the power of x |
Perform the appropriate regression.
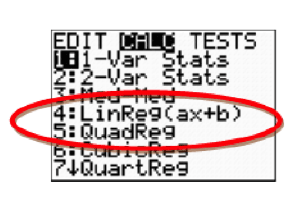
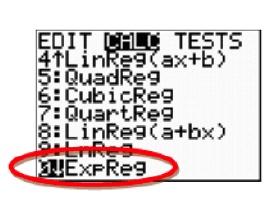 Two calculator screen shots appear. Both screen shots are of the stat calculation menu. The screen shot on the left uses a circle to emphasize option 4, linear regression, and option 5, quadratic regression. The screen shot on the right uses a circle to emphasize option 0, exponential regression.
Check the correlation coefficient (r).
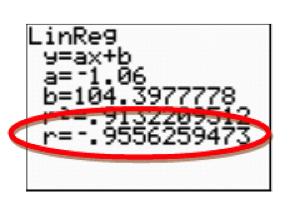
The correlation coefficient is a measurement of how well a regression line fits the data. It averages how far each data point is from the regression line. The correlation coefficient is the r value given by the calculator when a regression calculation is performed. The value of the correlation coefficient is always between -negative1 and 1. The closer the value is to -negative1 or 1, the better the fit. The closer the value is to 0, the worse the fit. If the correlation coefficient is negative, the correlation between the variables in the data is also negative. This means that as the independent variable increases, the dependent variable decreases (that is, as the x values increase, the y values decrease). If the correlation coefficient is positive, the correlation between the variables in the data is also positive. This means that as the independent variable increases, the dependent variable increases (that is, as the x values increase, the y values increase).
Check the coefficient of determination (R2r squared).
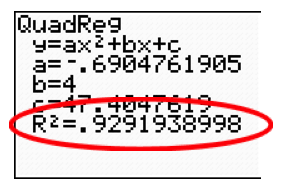
The coefficient of determination works the same as the correlation coefficient, which measures the proportion of the variance in the dependent variable that is predictable from the independent variable in the regression equation. The coefficient of determination will always be positive, and will always be between 0 and 1. The closer the value is to +positive1, the stronger the fit. The closer the value is to 0, the weaker the fit.
Analyze the data.
Use the regression curve that produced the strongest fit to interpret, extrapolate and interpolate the data. (Extrapolating data is when you predict data points outside of the given data set. Interpolating data is when you predict data points within the given data set.)